[Vue3]echarts使用Composition API變動圖表範例
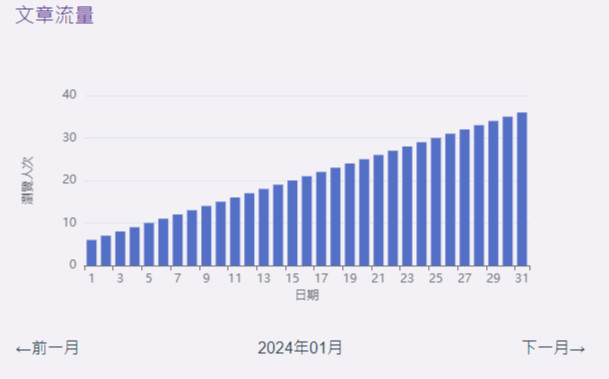
目標畫面:每月文章瀏覽量echarts圖表
使用版本:
echarts: “^5.4.3",
vue: “^3.3.8"
官方範例中畫面產生沒有問題,但切換參數(如範例中更換月份)圖表沒有更新
需要結合watch跟ref來更新
index.vue
<div ref="chartPic" style="width:100%;height:300px;"></div>
<table class="w-100">
  <tr>
    <td><a @click="goNextMonth('p')">←前一月</a></td>
    <td class="text-center">{{nowMonthText}}</td>
    <td class="text-end"><a @click="goNextMonth('n')">下一月→</a></td>
  </tr>
</table>
import * as echarts from 'echarts'
export default {
name: "indexPage",
setup(){
//圖表設定
let List1 = ref([1, 2, 3, 4])
let List2 = ref( [10, 15, 20, 8])
let nowMonthText = ref('') //顯示現在月份
let nowMonthNum = ref(0) //0為目前月份 -1前一月份 1下一月份
//取得月份最後一天是幾號
function getMonth(months) {
let d = new Date()
let year = d.getFullYear()
let month = d.getMonth() + 1
if (Math.abs(months) > 12) {
months = months % 12
}
if (months !== 0) {
if (month + months > 12) {
year++
month = (month + months) % 12
} else if (month + months < 1) {
year--
month = 12 + month + months
} else {
month = month + months
}
}
month = month < 10 ? "0" + month: month;
let lastday = "";
month = month.toString()
nowMonthText.value = year + '年' + month + '月'
if (month === "01" || month === "03" || month === "05" || month === "07" || month === "08" || month === "10" || month === "12") {
lastday = 31
} else if (month === "02") {
if ((year % 4 === 0 && year % 100 !== 0) || (year % 100 === 0 && year % 400 === 0)) {
lastday = 29
} else {
lastday = 28
}
} else {
lastday = 30
}
let day = ""
day = lastday
return day
}
//當月最後一天幾號
function chartUpdated(){
const endDay = getMonth(nowMonthNum.value)
List1.value = []
List2.value = []
for (let i = 1; i < endDay+1; i++){
List1.value.push(i)
List2.value.push(i+5)
}
}
chartUpdated()
//前一月/後一月
function goNextMonth(type){
if (type === 'p'){
nowMonthNum.value = nowMonthNum.value - 1
}else {
nowMonthNum.value = nowMonthNum.value + 1
}
chartUpdated()
}
const chartPic = ref(null)
let optionValue = {
grid: {
left: 70
},
xAxis: {
type: '',
data: List1.value,
name: '日期',
nameLocation: 'center',
nameGap: 25
},
yAxis: {
type: 'value',
name: '瀏覽人次',
nameLocation: 'center',
nameGap: 50
},
tooltip: {
trigger: 'axis',
formatter: "日期:{b0}<br/> 瀏覽人次:{c0}"
},
series: [
{
data: List2.value,
type: 'bar'
}
]
}
function chart(){
chartPic.value.setAttribute("_echarts_instance_", "")
let myChart = echarts.init(chartPic.value)
myChart.setOption(optionValue)
window.addEventListener("resize", () => {
myChart.resize()
})
}
onMounted(() => {
chart()
})
watch(() => List2.value, (newList2) => {
console.log(newList2)
optionValue.xAxis.data = List1.value
optionValue.series[0].data = newList2
chart()
}, { deep: true })
return{
goNextMonth,
nowMonthText,
chartPic
}
}
}變更List2的數據來源即可顯示後端提供的資料